Copyright © 2011-2014 airxc.com, airxcell.com
The purpose of this dynamic form is mostly to provide the user with a way to load and manage constituents that can furtherly be used in the Portfolio (15) dynamic form. In addition, it enables the user to show or chart (chart) the loaded assets along with several kinds of additional informations.
This form is called "1. Manage Assets" since it uses extensively the commodities provided by the R quantmod package to load and work with asset timeseries. The rMetrics package provides several useful commodities as well and one might well want to have a look at those.
A new "1. Manage Assets" form can be added to the workspace by using
Form → 1. manage assets
(![]() )
)
Portfolio optimization and the acquisition and selection of financial data as input go hand in hand. The Manage Assets (10) module provides a intuitive way of working with financial time series.
A financial time series consists of the data themselves and date/time stamps, which tell us when the data were recorded. In the generic case, when we consider a multivariate data set of financial assets, the data, usually prices or index values, are represented by a numeric matrix, where each column belongs to the data of an individual asset and each row belongs to a specific time/date stamp. This is most easily represented by a position vector of character strings. Combining the string vector of positions and the numeric matrix of data records, we can generate timeSeries objects.
Financial time series analysis investigates and models data sets from financial markets. These are usually prices, indices and derived values such as returns, cumulated returns, volatilities, drawdowns and durations, amongst others.
In the set of quantmod or rMetrics dynamic forms currently implemented in
AirXCell, the financial timeseries are daily based.
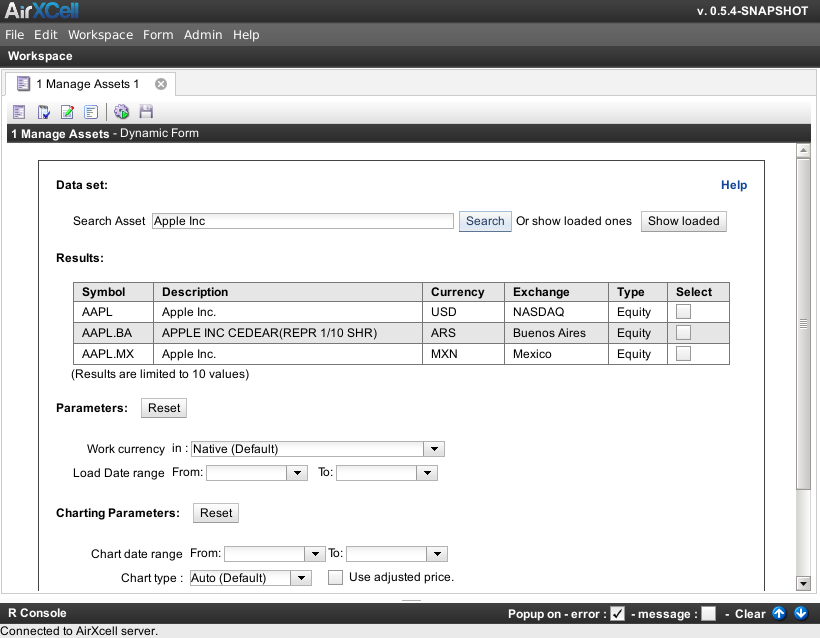
For instance, the figure Figure 10.1, “1. Manage Assets' dynamic form” shows a "1. Manage Assets" dynamic form
after the user searched for Apple Inc:
From that result list, the user can either load or chart, show, etc. each listed Asset (See
Section 10.4, “Results”).
The Dataset part of the form enables the user to search for a specific asset on online data sources such as google finance or yahoo finance. The system automatically searches on various sources for the target asset, but the default source is yahoo finance. The search starts whenever the user presses ENTER or clicks on the Search button.
The button Show loaded enables the user to show the assets that have already been loaded through this form and makes them available for further operations as described below under Results (10.4).
The Results part shows the found assets or the ones that have already been loaded depending on what is being displayed. Due to limitations on the online data provider, only the first ten matches can be displayed as of current version of this dynamic form. Various informations are shown for each result such as the type of asset, the exchange or the currency. The currency is not provided by the default search engine, hence the system needs to search the currency for each result after the results have been displayed, asynchronously. As long not every currency have been fetched, the result list remains disabled and cannot be used further.
The check-boxes on the rightmost column are used upon the form submition to trigger specific actions. Each check-box corresponds to a specific action:
- L : Load the asset
- S : Show the asset in a new data frame module (8)
- I : Show available financial informations on asset
- P : Chart the asset
- D : Delete the asset (provided it has been loaded previously)
Some of these actions are dependent on the settings given on the part Parameters (10.5) below.
Any asset is by default loaded in its original currency (Currency : Native (Default)). The user
has the possibility to choose here a different currency which will be applied to the loaded or chartted asset.
If the required FOREX is not already loaded, it will be loaded or completed upon form submission. The selected
currency applies to actions : load, show and
chart.
Select the date ranges for which the asset has to be loaded, on a daily basis. If unspecified, the start date is four years before the current day while the end date is today.
Useful for chartting a subset of the loaded asset. User can type in the start and end dates of the range she wants to display. If unspecified, the start date is the first date of the asset timeseries and the end date is the last date of the timeseries.
The user can choose the type of the chart. The supported types are:
- Auto : select the type of the chart automatically depending on the range, the type of asset, etc.
- Candle Sticks : use candle sticks, showing every day Open, Close, High and Low.
- Match Sticks : same as candle sticks, shows Open, Close, High and Low but in a different way (shorter).
- Bars : same as candle sticks, shows Open, Close, High and Low but with little horizontal bars for Open and Close.
- Line : shows continuous lines using Close price.