Copyright © 2011-2014 airxc.com, airxcell.com
The GNU R project for statistical computing is a powerful computation environment with abilities going much beyond statistical computing only. It's primary User Interface consists in a simple - yet very powerful - command line.
AirXCell implements a complete R command line interface in the form of The R Console. The big advantage here is that this console is available from within a Web browser and benefits from all the other aspects of AirXCell; to name only a few:
- One click saving of the workspace (i.e. obiously along with the R environment) and retrieval from anywhere (provided it has been saved on the server),
- A convenient R Code Editor which can be used to develop R functions or procedures much more efficiently than using the sole console,
- A DataFrame editor which one can use to visualize and manipulate the data frames created from within the console,
- and all other features from AirXCell.
We'll cover here the very few steps required to put the R console in fullscreen and use it as a plain old R command line, yet benefiting from AirXcell's advantages as covered above.
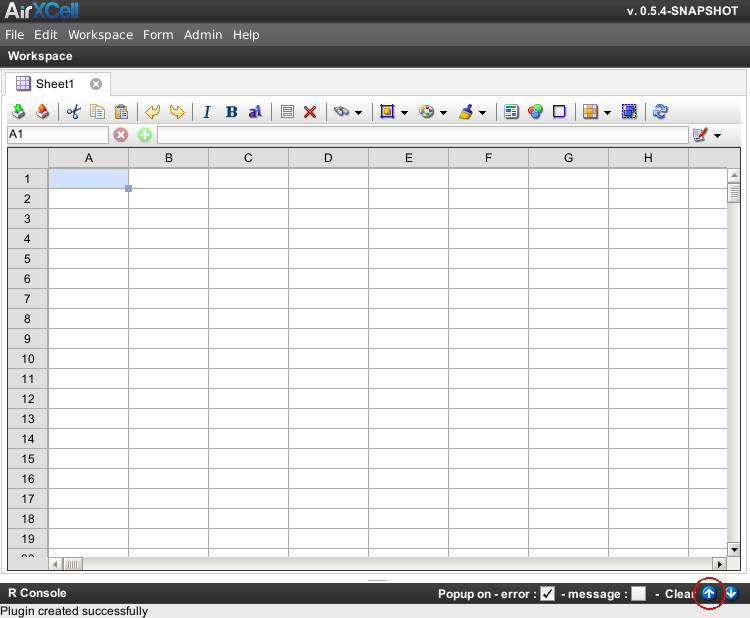
The first step is to use the fullscreen button from the console title pane to put the console in full screen. That button is located on right side of the console title as shown on Figure 2.1, “Put console in fullscreen”
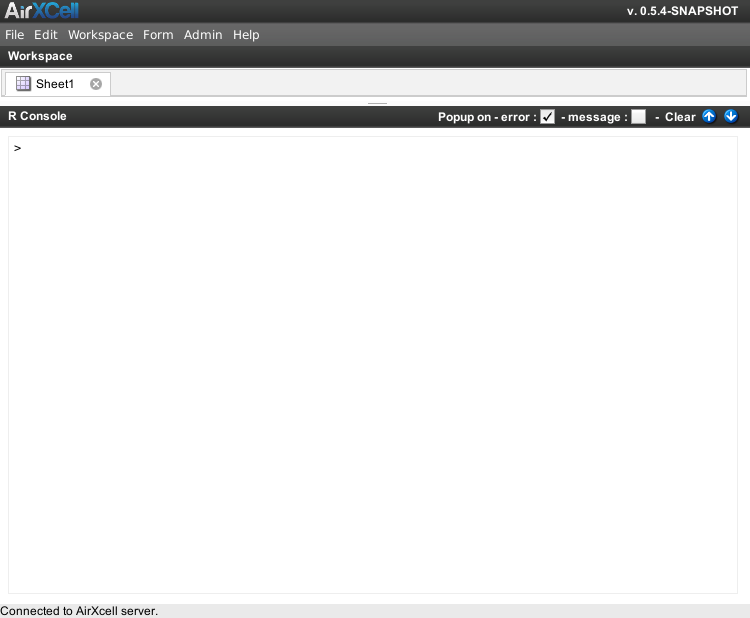
The console in full screen is especially convenient for plain old R users used to the command line interface to R.
The result of clicking on the fullscreen button button is a fullscreen console, taking all the available place usually devoted to the workspace modules is shown on Figure 2.2, “Console in fullscreen”. The workspace modules tab bar is still shown. The user can use drag and drop on the splitter to tune the precise size she wants to give to the R console. The splitter is the little horizontal bar located between the workspace and the R console.
Commands are issued to the console just as with an usual R command line. We'll see here a few examples.
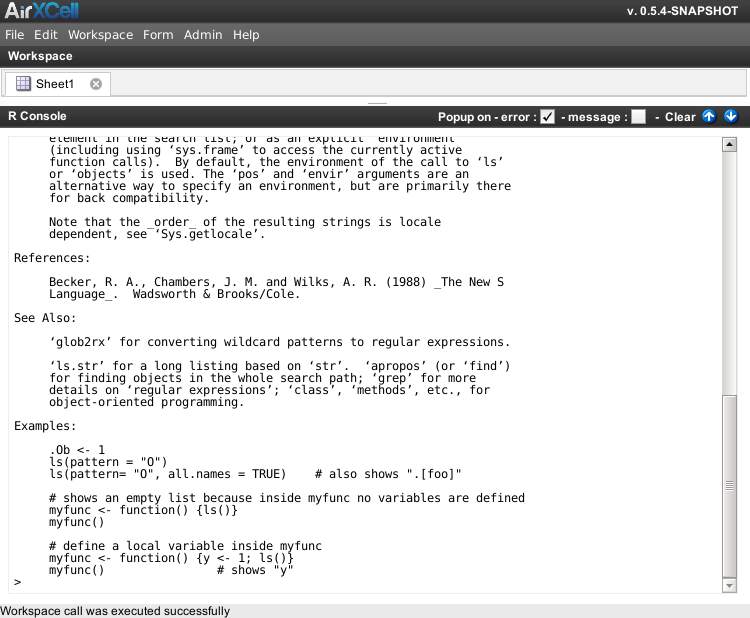
For instance the result of the command ? ls (help of the ls command) is shown on
Figure 2.3, “Result of the '? ls' command”. AirXell fully supports R's help system and
implements a simple pager that outputs the help call results on the console.
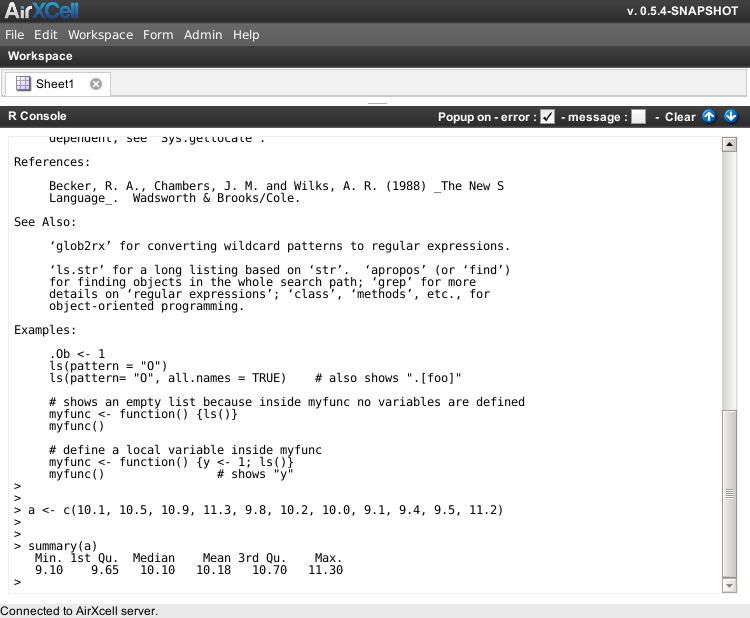
Defining a set of data and using the summary command is performed as shown on
Figure 2.4, “Working with data and summary”. (The R summary command is defined and available
for pretty much every data type in R).
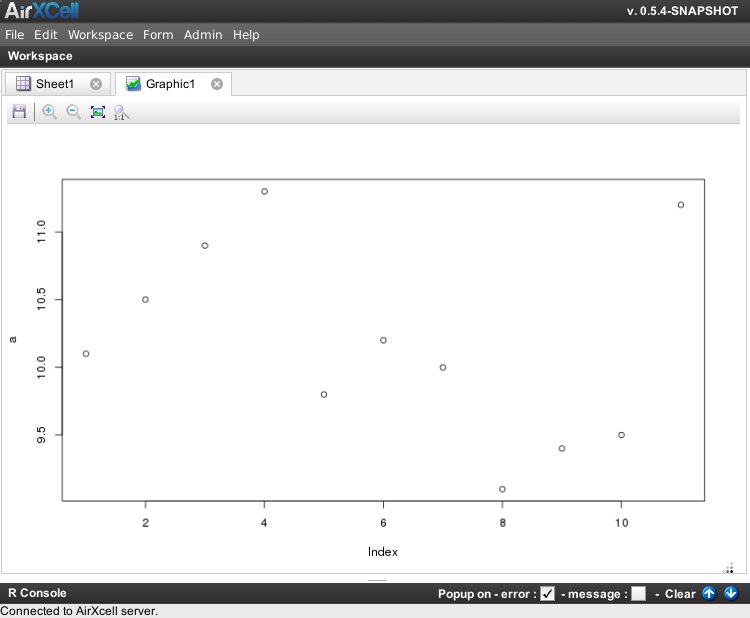
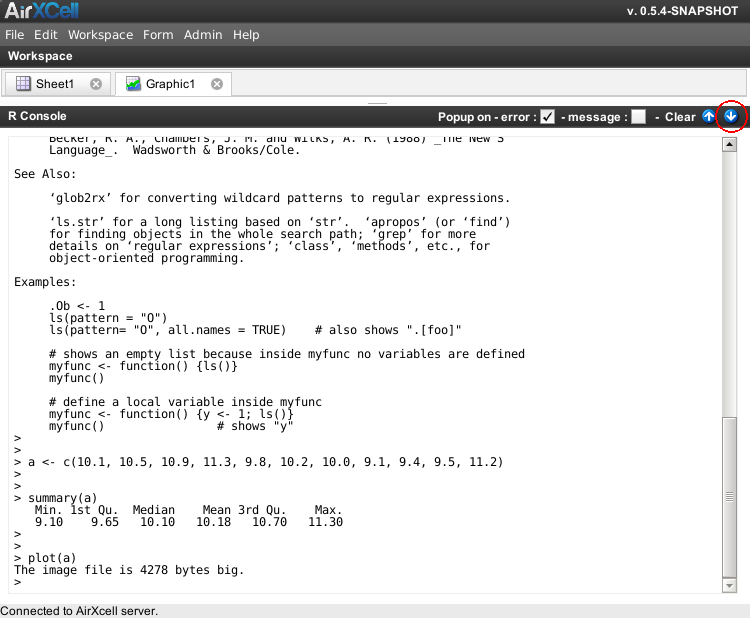
AirXCell fully supports R's static charts. In order to support charts, AirXCell implements a PNG plotting device that generates plots as PNG images and downloads the results within the workspace. (Interactive plots (dynamic charts) are not supported however as of current version of AirXcell.)
For instance, one can simply use the plot command to chart the previously defined set of data
a as shown on Figure 2.5, “Charting data”.

Once the chart is generated (the very first generation of a chart takes a few seconds within AirXCell), the result of the chart is displayed within a new graphic module embedded within the AirXcell workspace. The user needs to hide the console in order to see the graphic. Hiding the console is performed by clicking on the Hide button as shown on Figure 2.6, “Hide console”.
Once the console is hidden, the resulting chart is presented to the user since the workspace automatically selected the new module as shown on Figure 2.7, “Result graphic”. The graphic is generated at the resolution (width x height in pixels) of the workspace.